 geo.be Metadata Catalog
Esri Geodatabase
Type of resources
Available actions
Topics
INSPIRE themes
federalThemes
Keywords
Contact for the resource
Provided by
Years
Formats
Representation types
Update frequencies
status
Scale
Resolution
-
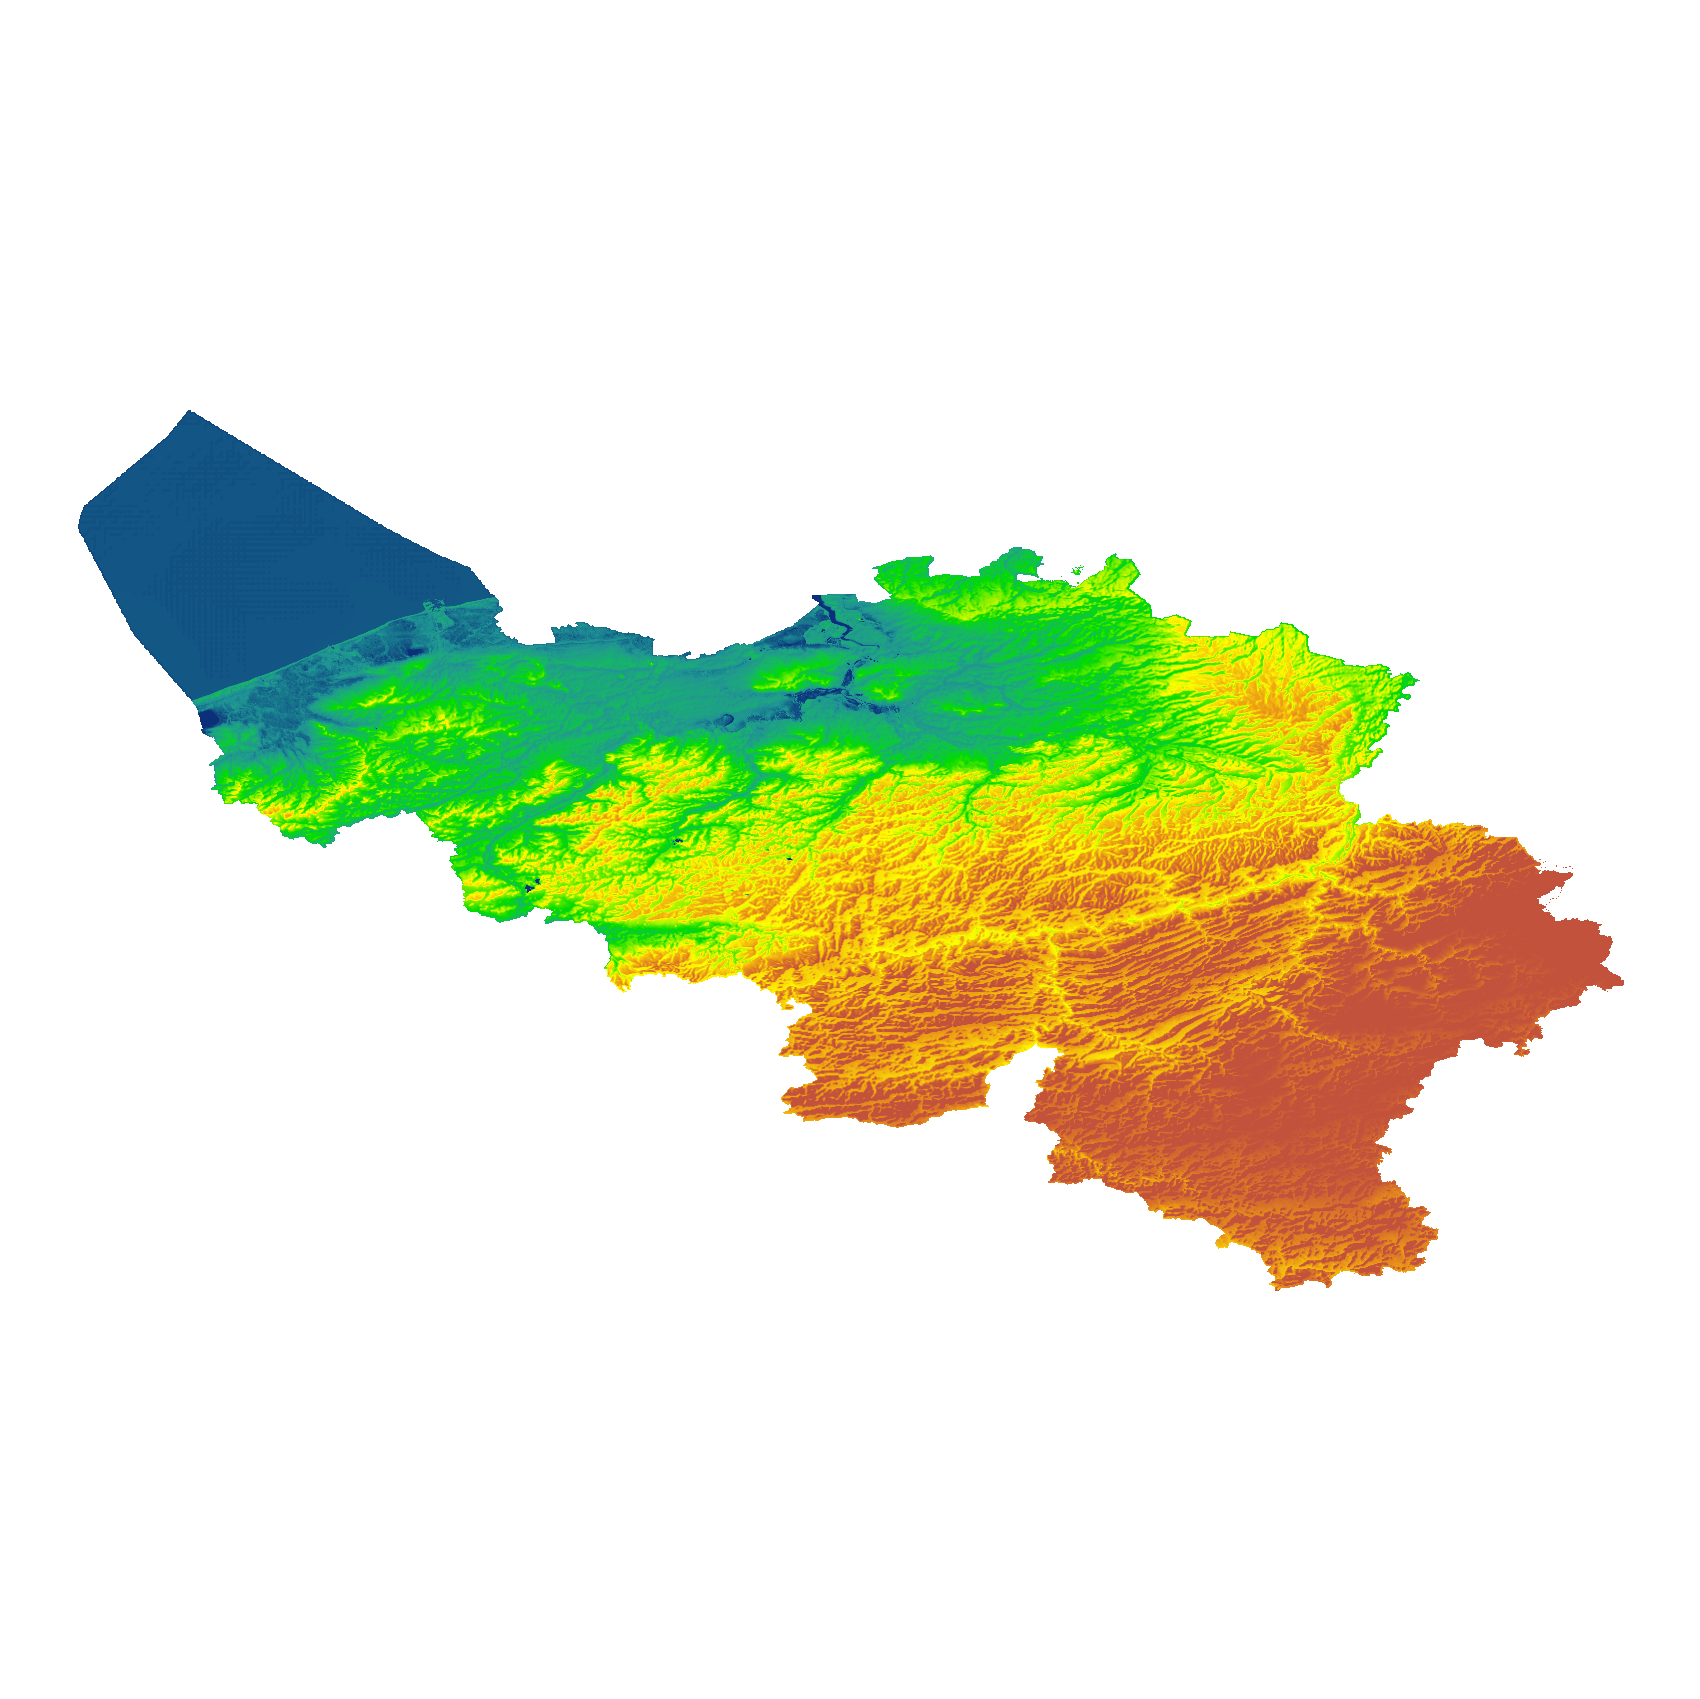
The eTOD digital terrain model (DTM) is a homogeneous and regular point grid indicating the elevation of the ground level in order to make a model of its surface. This DTM is obtained by resampling raw altimetric source data from the Flemish and Walloon Regions, grouped in Lambert 72 and with a resolution of 1 m; as well as data obtained internally by direct photogrammetric recording of structure points and lines based on the most recent aerial photographs for all areas not covered by regional data. For this DTM, the resolution and coordinate reference system are used as defined by the eTOD specifications.
-
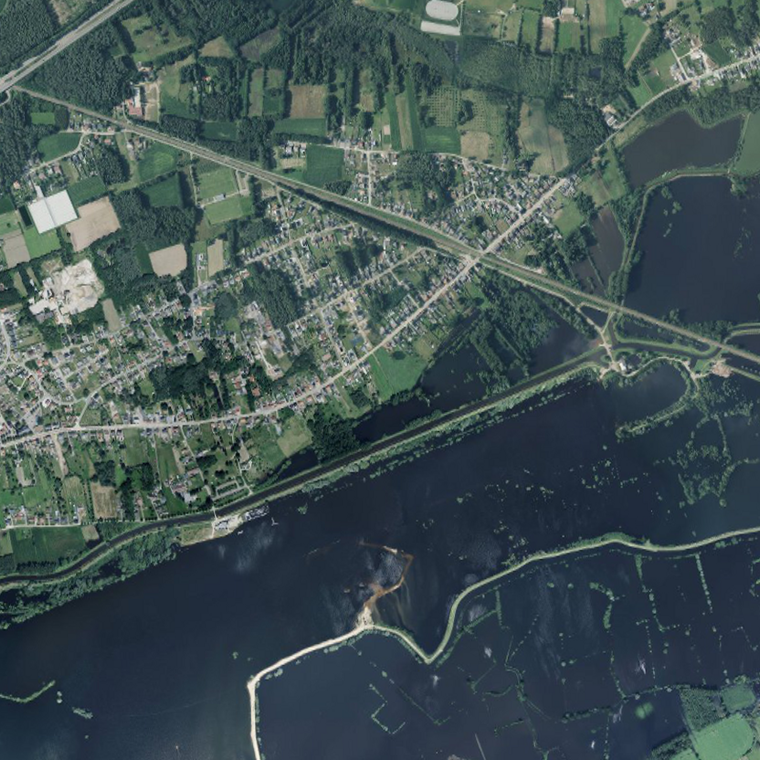
This dataset contains the orthophotos of the floodable areas along the Meuse, the Vesdre and the Demer. These orthophotos are digital aerial photographs, taken by Hansa Luftbild following the floods of July 2021, in which the systematic distortions due to the central projection, relief and the not always perfectly vertical axis of shooting have been corrected. The orthophoto thereby obtained is metrically more accurate than an ordinary aerial photograph and is highly valuable as basic information. The resolution of the data is 6.5 cm (4 cm above the Hoëgne).
-
The digital terrain model (DTM) is a homogeneous and regular point grid indicating the elevation of the ground level in order to make a model of its surface. The 1m DTM is obtained by interpolation in Lambert 2008 of the raw height data regrouping the source data, in Lambert 72 and at 1m resolution, of the Flemish and Walloon regions. The 5m DTM has as an additional source structure lines and adapted points, during the systematic and continuous updating by photogrammetric surveys. The 20m DTM, available for free download, is obtained by resampling the 1m DTM.
-
This dataset shows a digital surface model. It is a homogeneous and regular points grid which indicates the height above the surface of the earth, either the soil or any other permanent and visible element in the landscape (vegetation, construction,…). These data represent the situation of the landscape resulting from the July 2021 floods in het areas of the Vesdre, of part of the Meuse downstream from Liège and of the Demer.
-
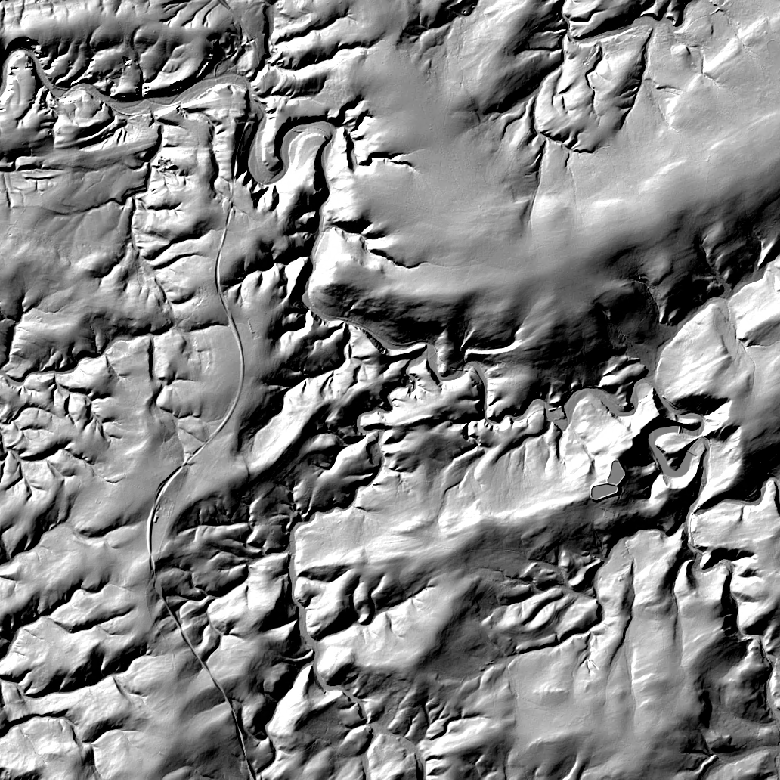
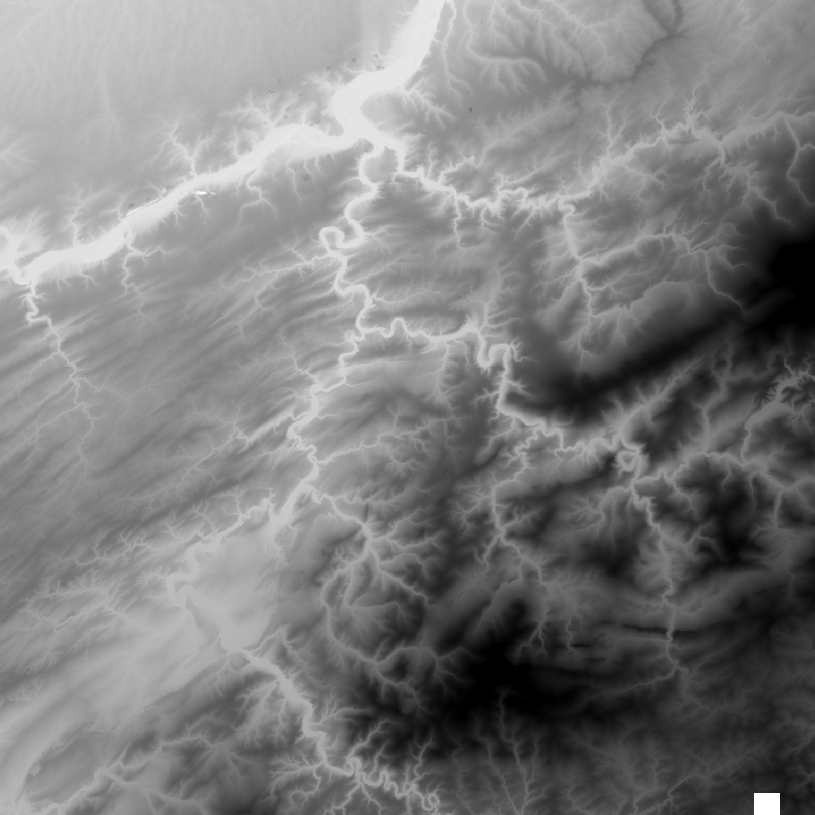
The hillshades are presented as a regular homogeneous grid of points indicating the grey level value resulting from their orientation with respect to the chosen fictitious light source. The 1m hillshade is the view obtained by hillshading of the 1m DTM. The 5m and 20m hillshades are the views obtained by hillshading of the 5m and 20m DTM.
-
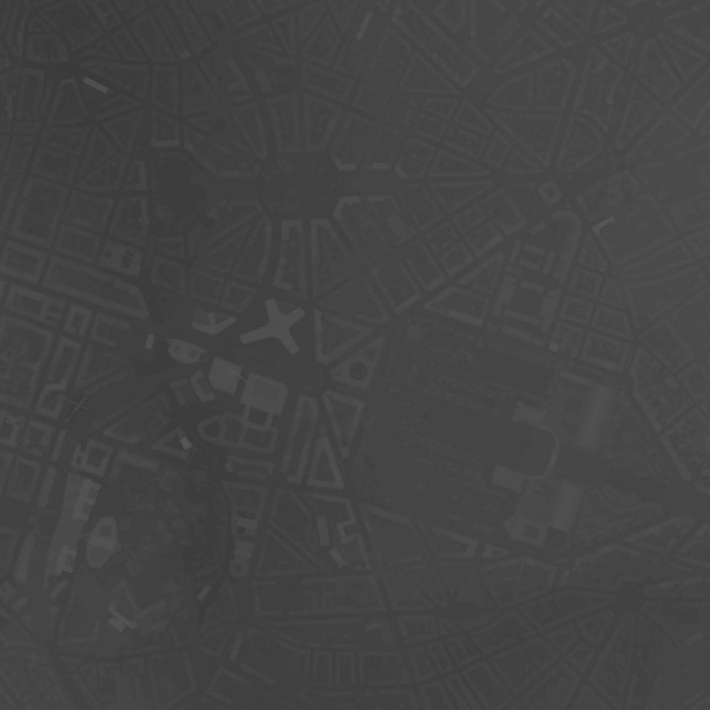
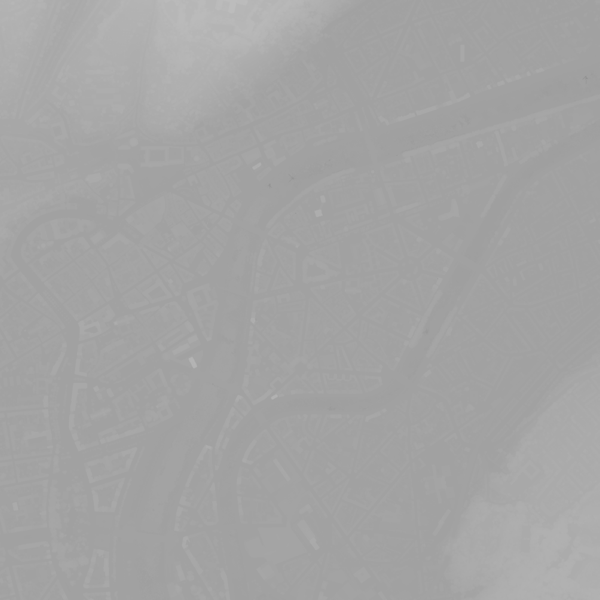
The digital surface model (DSM) 1m is a homogeneous and regular grid of points indicating the height of the earth's surface in order to model the landscape. The product "DSM1meter", abbreviated DSM 1m, gives every 1m in X and Y the height of the earth's surface, i.e. the ground or any other permanent and visible element of the landscape (vegetation, construction, ...) in relation to the Belgian zero level (fictitious zero D of Uccle). It is therefore the orthometric height, commonly called: altitude.
-
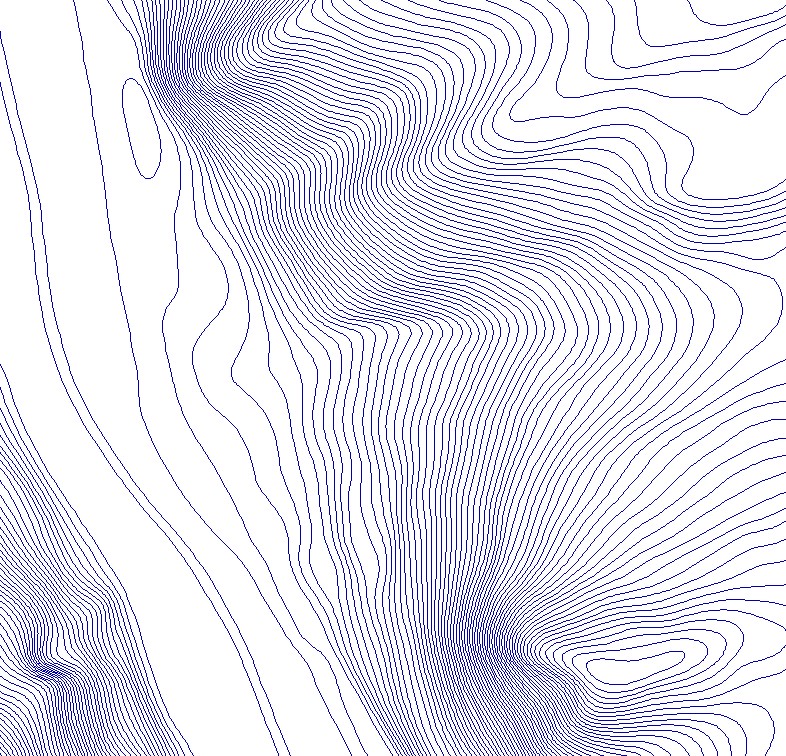
The contour lines are the set of lines connecting all points at the same elevation in a model used to represent the relief on a large scale.
-
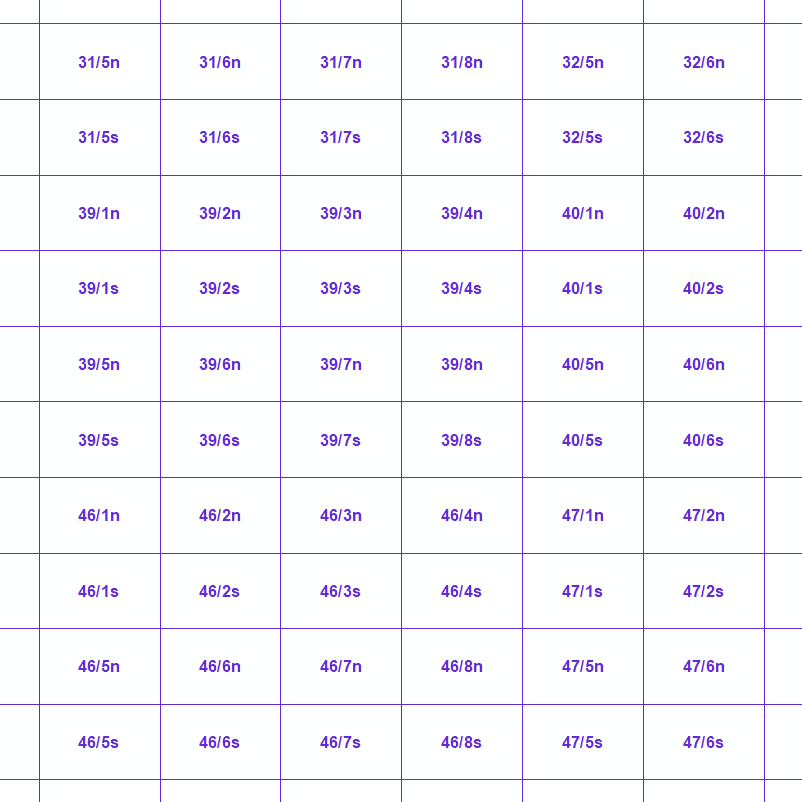
MapIndex is a regular grid of rectangular or square cells coded with alphanumeric characters. It has been defined for the Belgian territory and allows geolacating several events. The present version is a beta (v2)version which is submitted to the emergency services. It will evolve to a standard cartographic grid.
-
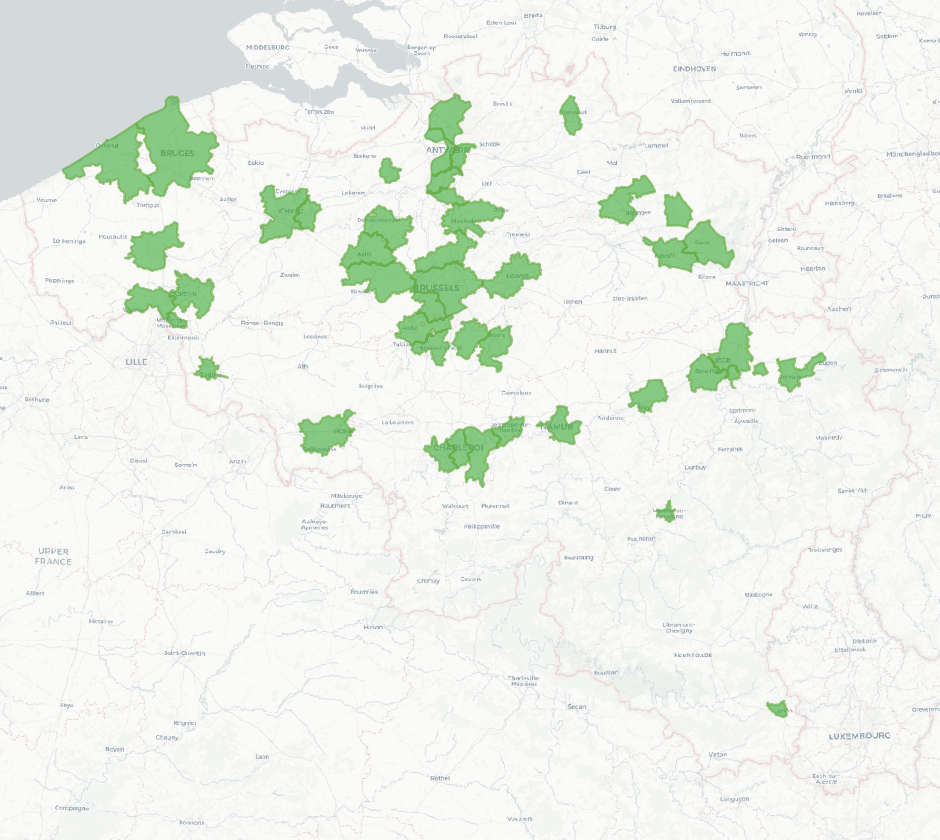
The National surveillance of SARS-CoV-2 monitors the SARS-CoV-2 presence in several wastewater treatment plants across Belgium. This dataset contains the catchment areas per wastewater treatment plant since the beginning of the surveillance is June 2020.
-
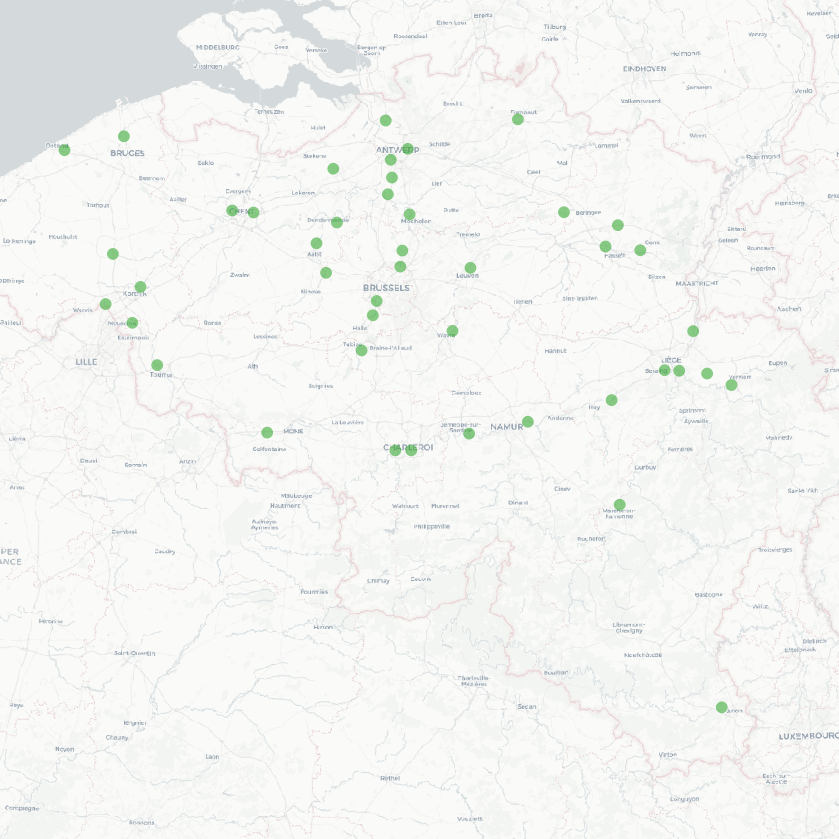
The National surveillance of SARS-CoV-2 monitors the SARS-CoV-2 presence in several wastewater treatment plants across Belgium. This dataset contains the results per treatment plant since the beginning of the surveillance is June 2020. The results consist in the SARS-CoV2 concentrations over time as well as other data needed for the interpretations such as the flow rates of the treatment plants and their covering populations.